Quick Links
Quick Links
Quick Links
Tabs give access to the tile features and additional features. When a tile is selected, that feature appears in the upper screen area, along with the row of tabs.
NOTE: Some items below are only displayed if machine is equipped with the associated option.
NOTE: These features are mirrored on the run page.
Feature Tabs— display the basic status of a feature. Each tab is selectable to access more information about the feature. When a tab is selected, that feature appears in the upper screen area.
Feature Tabs
|
Tile Access Tab— select at any time to display the feature tiles. |
Tile Access Tab |
|
Additional Features Tab— select to display tiles for additional features. |
Additional Features Tab |
Additional Feature Tiles
|
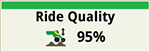
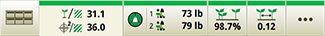
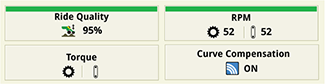
Ride Quality— tile displays the percentage of ride quality for the row units. The value is an average for all rows. Select to view additional ride quality details. |
Ride Quality Tile |
|
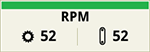
RPM— tile displays the revolutions per minute (RPM) of the seed meter and BrushBelt motors. The value is an average for all rows. Select to view additional RPM details. |
RPM Tile |
|
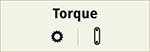
Torque— tile displays the torque of the seed meter motors. Select to view the relative torque bar chart for meter motors and brush belt motors. |
Torque Tile |
|
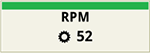
RPM— tile displays the revolutions per minute (RPM) of the seed meter motors. The value is an average for all rows. Select to view additional RPM details. |
RPM Tile |
|
Torque— tile displays the torque of the seed meter motors. Select to view the relative torque bar chart for meter motors. |
Torque Tile |
|
Tools— provides access to a page of quick links that open frequently used and helpful features. |
Tools Button |
|
Curve Compensation— icon inside the tile changes to indicate the current implement path. Select to view additional details and to enable or disable the curve compensation. |
Curve Compensation Tile |
Feature Status— on top of each tile and tab, changes color based on the feature parameters and range limits.
|
Green |
|
Amber |
|
Red |
NOTE: Values are also highlighted with a red box when they are out of range. The row number associated with the value is displayed.
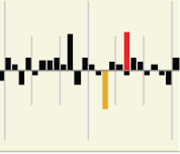
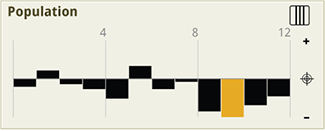
Bar Graph Status— is indicated for every row using three different bar colors.
|
Bar Graph Status |
Population— screen area displays the seed population for all of the engaged rows. Select to view additional population details and to adjust the target populations.
Population
|
Advanced Settings— access further adjustments and less common settings. |
Advanced Settings |