Quick Links
Quick Links
Quick Links
Ride Quality allows you to view the degree of vibration affecting the row unit as detected by the sensors on the row units.
NOTE: A lower ride quality affects the MaxEmerge meter more than the ExactEmerge meter. Downforce, ground conditions, and ground speed relate closely to ride quality.
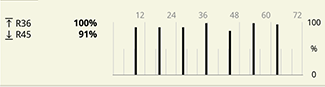
Ride Quality— displays the row number (R_) with the highest ride quality and the row number (R_) with the lowest ride quality.
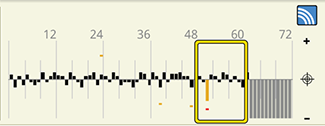
Bar Graph— displays the percentage of ride quality for the rows with sensors. Perfect (smooth) ride quality is indicated as 100%. Select an area of the graph to zoom in to that area. The selected area is outlined with a yellow box that is moveable with the adjustment dial.
Ride Quality Graph
|
Population Graph with Selected Area |
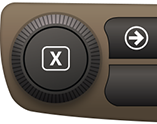
Adjustment Dial |
NOTE: Select the tab to exit the zoom area at any time.