Quick Links
Quick Links
Quick Links
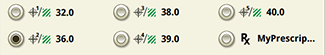
Population displays the seed population for each row, provides access to your target populations, and allows you to zoom to specific row details.
Target Population— appears differently depending on the target population mode that you selected under Population Setup in Advanced Settings.
|
Target Population (Basic)— screen area displays your target populations. Select a target population to enable that population for the entire implement. Select Edit Population to change your target population values. |
Edit Population |
Target Population (basic)
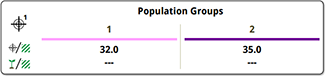
Advanced Target Population— screen area displays your target populations and the actual populations for each seed variety that you have set up. Select the screen area to change your populations.
Populations
Select any segment in the screen area to view the details for the row number displayed.
|
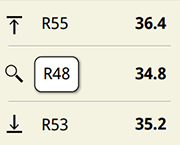
High Population— (upper screen segment) displays the row number (R_) and population for the row with the highest population. User Selected— (middle screen segment) displays the row number (R_) and population for the row that you enter into the input box. Low Population— (lower screen segment) displays the row number (R_) and population for the row with the lowest population. |
Row Specific Population |
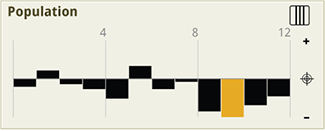
NOTE: Population values approaching an alarm limit highlight in amber. Values outside an alarm limit highlight in red.
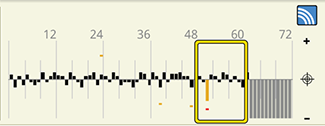
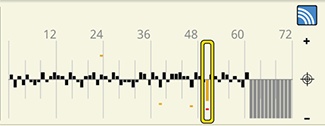
Population— bars in the graph represent the population of each row unit. As the population varies, the bars vary in size either over (+) or under (-) the target population. Row numbers are displayed along the top to separate areas of the graph.
Population Bar Graph
Section Zoom— allows you to zoom into an area of the population graph between the displayed row numbers. Select an area of the graph. The rows in the selected area expand into the upper screen area. The selected area is outlined with a yellow box that is moveable with the adjustment dial on some displays.
|
Population Graph with Selected Area |
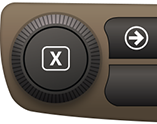
Adjustment Dial |
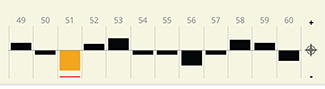
Expanded Area— displays each row within the selected area.
Expanded Area
Row Zoom— select a row from the expanded area. A yellow box outlines the row selected on the population graph. Details of the selected row appear in the upper screen area.
Population Graph with Selected Row
Row Details— displays specific values related to the selected row. Seed sensing is on the left-hand side. Downforce is on the right-hand side. Descriptions of these items can be found on the Alarms and Gauge Wheels setup pages.
NOTE: Population values approaching an alarm limit highlight in amber. Values outside an alarm limit highlight in red.
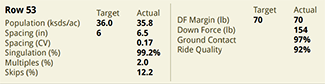
Selected Row Details