Quick Links
Quick Links
Quick Links
The SeedStar - Overview provides access to all of the monitored aspects for the row units. The items accessible in the upper screen area vary according to machine configuration. The population details are always displayed on this main page.
NOTE: These features are mirrored on the run page.
Feature Tiles— display the basic status of a feature. Each tile is selectable to access more information about the feature. When a tile is selected, the details for that feature appear in the upper screen area.
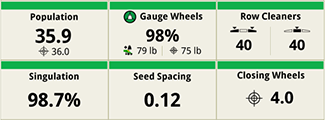
Feature Tiles
Feature Tile Status— appears as a color on the top of each tile. The status color is based on the feature parameters and range limits.
|
Green |
|
Amber |
|
Red |
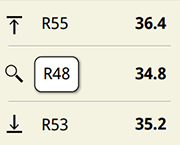
Select any segment in the screen area to view the details for the row number displayed.
|
High Population— (upper screen segment) displays the row number (R_) and population for the row with the highest population. User Selected— (middle screen segment) displays the row number (R_) and population for the row that you enter into the input box. Low Population— (lower screen segment) displays the row number (R_) and population for the row with the lowest population. |
Row-Specific Population |
NOTE: Population values approaching the alarm limit highlight in amber. Values outside the alarm limits highlight in red.
Population— screen area displays the seed population for all of the engaged rows. Select to view additional population details and to adjust the target populations.
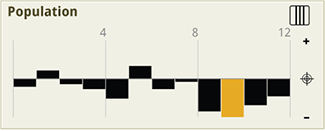
Population
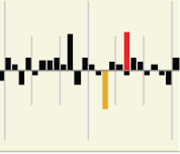
Bar Graph Status— is indicated for every row using three different colored bars.
|
Bar Graph Status |
|
Tools— provides access to a page of quick links that open frequently used and helpful features. |
Tools Button |
|
Advanced Settings— access further adjustments and less common settings. |
Advanced Settings |