Area has been worked once.
![]()
Area has been worked more than once.
![]()
Work data includes rate, product, and coverage (work state) information. It is recorded based on GPS location and time. Work data files include the following information:
Time
Latitude and longitude
Elevation
Field name (if set by operator)
Work data is managed in multiple applications.
Use Mapping application to view work data maps.
Use File Manager to export work data to John Deere Operations Center or a USB drive.
Work data is displayed in map view based on the following criteria:
Field Name
Select a field name to recall work data for that field.
GPS Location
Work data is displayed in map view for 0.64 km (0.4 mi) in each direction from GPS location.
To clear work data from map view, select New Work.
There is no size limit for recording work data for each field name. The only limit is the memory capacity of the display. Available display memory is found in Status Center on the run page.
Coverage data displays where work has been done. It displays on the map as blue and dark blue:
|
Area has been worked once. |
|
|
Area has been worked more than once. |
|
The following component is required to record coverage data:
StarFire Receiver
The coverage map aligns with area worked total in Work Monitor.
When using See & Spray mode, coverage is painted when Work Recording is ON, even if the system is not actually applying product.
Documentation data is a record of the types and amounts of seed or product used or crop harvested.
NOTE: Documenting work data is not available with a 4100 CommandCenter.
The following component is required to record documentation data:
StarFire Receiver
|
Pass visualization displays black borders for each pass and arrows indicating the direction of travel. |
|
Rate map displays rate received from machine or implement control unit. If an area is covered more than once, rate of most recent pass is displayed.
When using See & Spray mode, the rate map displays the applied rate for sections where product was actually applied. Areas that were covered by the boom with See & Spray active but were not sprayed are displayed with semi-transparent gray coverage.
Dry yield map displays the average dry yield received from combine control units.
Moisture map displays the average moisture of the harvested crop received from the moisture sensor.
Variety map displays the varieties of a planted crop in the field. Up to ten different colors are used to distinguish varieties. If more than ten varieties are recorded, colors are repeated.
Product map displays products or tank mixes applied to the field. Up to ten different colors are used to distinguish between products and tank mixes. If more than ten products and tank mixes are recorded, the colors are repeated.
NOTE: The product map layer is only displayed when applying a single liquid operation.
Edit the map legend to set the minimum and maximum values for the legend range.
Weed pressure map uses the sensing system of the machine to display where weeds are concentrated (weed pressure) in the field. The map shows the percentage of vegetation coverage by plants that are not identified as the crop.
Crop canopy map uses the sensing system of the machine to display area covered by crop. The map shows the percentage of vegetation covered by crop (in green) and areas covered by weeds (in red).
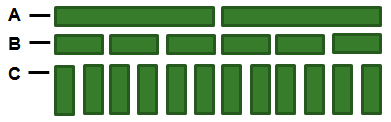
Using a planter, seed rate is recorded as an average of rows in each drive motor section. If one row becomes blocked and stops planting, population rate for drive section decreases.
|
12 Row, 6 Section, 2 Drive Motor Planter Configuration |
|
|
Variable rate drive motors determine seed rate in work data.
Sections turn on and off with Section Control and determine coverage (work state) in work data.
Row Units are shown.