Toggle map view to select rate map.

Open the legend.

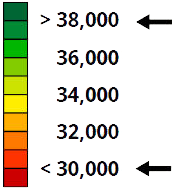
Edit minimum and maximum values to adjust ranges that each color represents. Values for middle ranges are automatically calculated as equal intervals.
|
Toggle map view to select rate map. |
|
|
Open the legend. |
|
|
Select View button to select the desired map layers to view. |
|
|
Select the legend.
Enter Greater Than and Less Than values. |
|
Map legend displays ten gradients.
When a prescription is selected in the Work Setup application, Greater Than and Less Than values are automatically set based on the high and low values in the prescription. The as-applied and preview map legends are matched to the prescription legend.