Quick LinksQuick Links
Spacing allows you to view the consistency of the seed spacing as detected by the seed sensor.
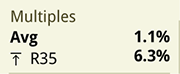
Multiples— displays the overall average (Avg) number of multiple seeds released at once from the meters. It also displays the row number (R_) for the row with the highest percentage of multiples. |
Multiples |
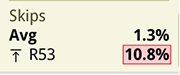
Skips— displays the overall average (Avg) number of skipped seeds from the meters. It also displays the row number (R_) for the row with the highest percentage of skips. |
Skips |
NOTE: Values outside the alarm limits highlight in red. Values near the alarm limits highlight in amber.
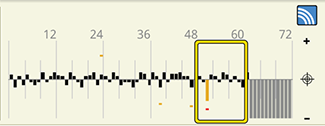
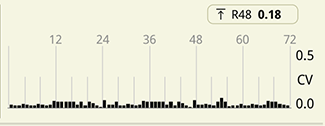
Seed Spacing— displays the row number (R_) (over the bar graph) for the row with the poorest spacing consistency.
Bar Graph— displays the seed spacing consistency for every row unit. Each bar over the zero line represents the amount of decrease in consistent spacing. Zero is perfect seed spacing. Select an area of the graph to zoom in to that area. The rows in the selected area expand into the upper screen area. The selected area is outlined with a yellow box that is moveable with the adjustment dial.
NOTE: Coefficient of variation (CV) is the measure of seed spacing. A description of the CV can be found on the Alarms.
CV Graph
Population Graph with Selected Area |
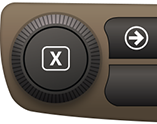
Adjustment Dial |
NOTE: Select the tab to exit the zoom area at any time.